In this post, I want to show you how to use the CrUX report template and connector to monitor your technical SEO in Data Studio. A few months back, Google announced “Core Web Vitals“, a new program that measures the quality of user experience on your website. The new program, of course has an impact on your SEO. In fact, you might have already seen it reflected in your Google Search Console. Since there are many important metrics within the “Core Web Vitals”, having a dashboard to track them can be quite handy. Below, I have shared a quick overview of the setup and interpretation of the CrUX report template.
How to setup the Chrome UX (CrUX) report?
Time Needed : 3 minutes
A quick guide on how to setup the CrUX dashboard template and test it for your own domain 🙂
Navigate to the CrUX dashboard template URL: g.co/chromeuxdash
1.1 Once the page loads, you would have to input your domain. The template works based only on an origin URL. Therefore, if you type in a specific page, you will get an error.
1.2 It is important to keep the box ticked, so the report template can be auto-generated.
1.3 Then click on the “Connect” button.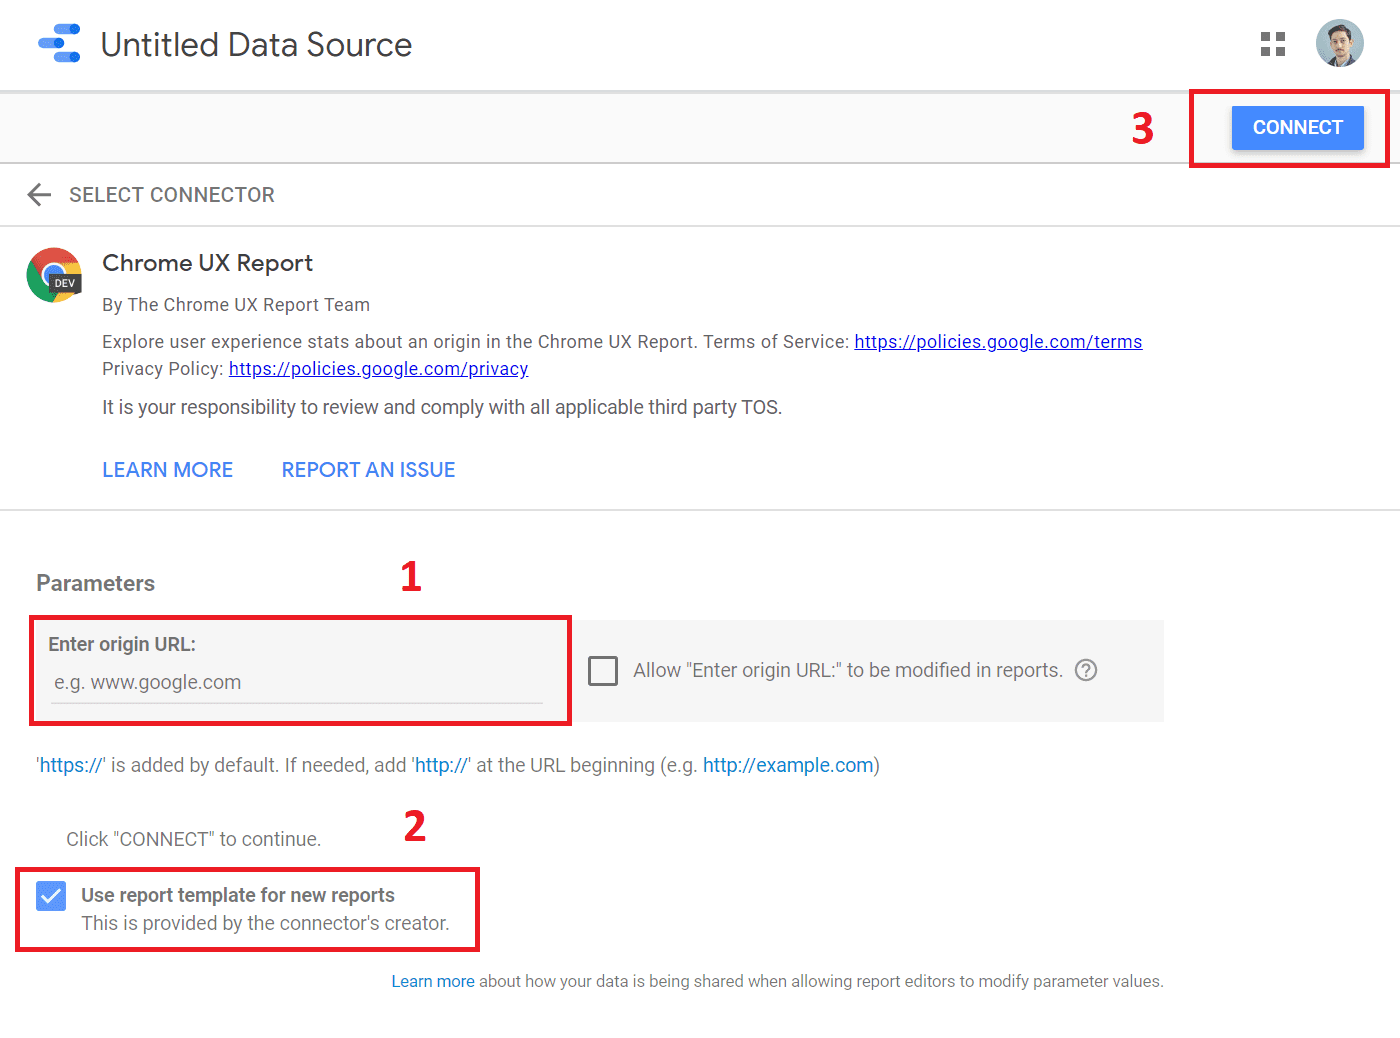
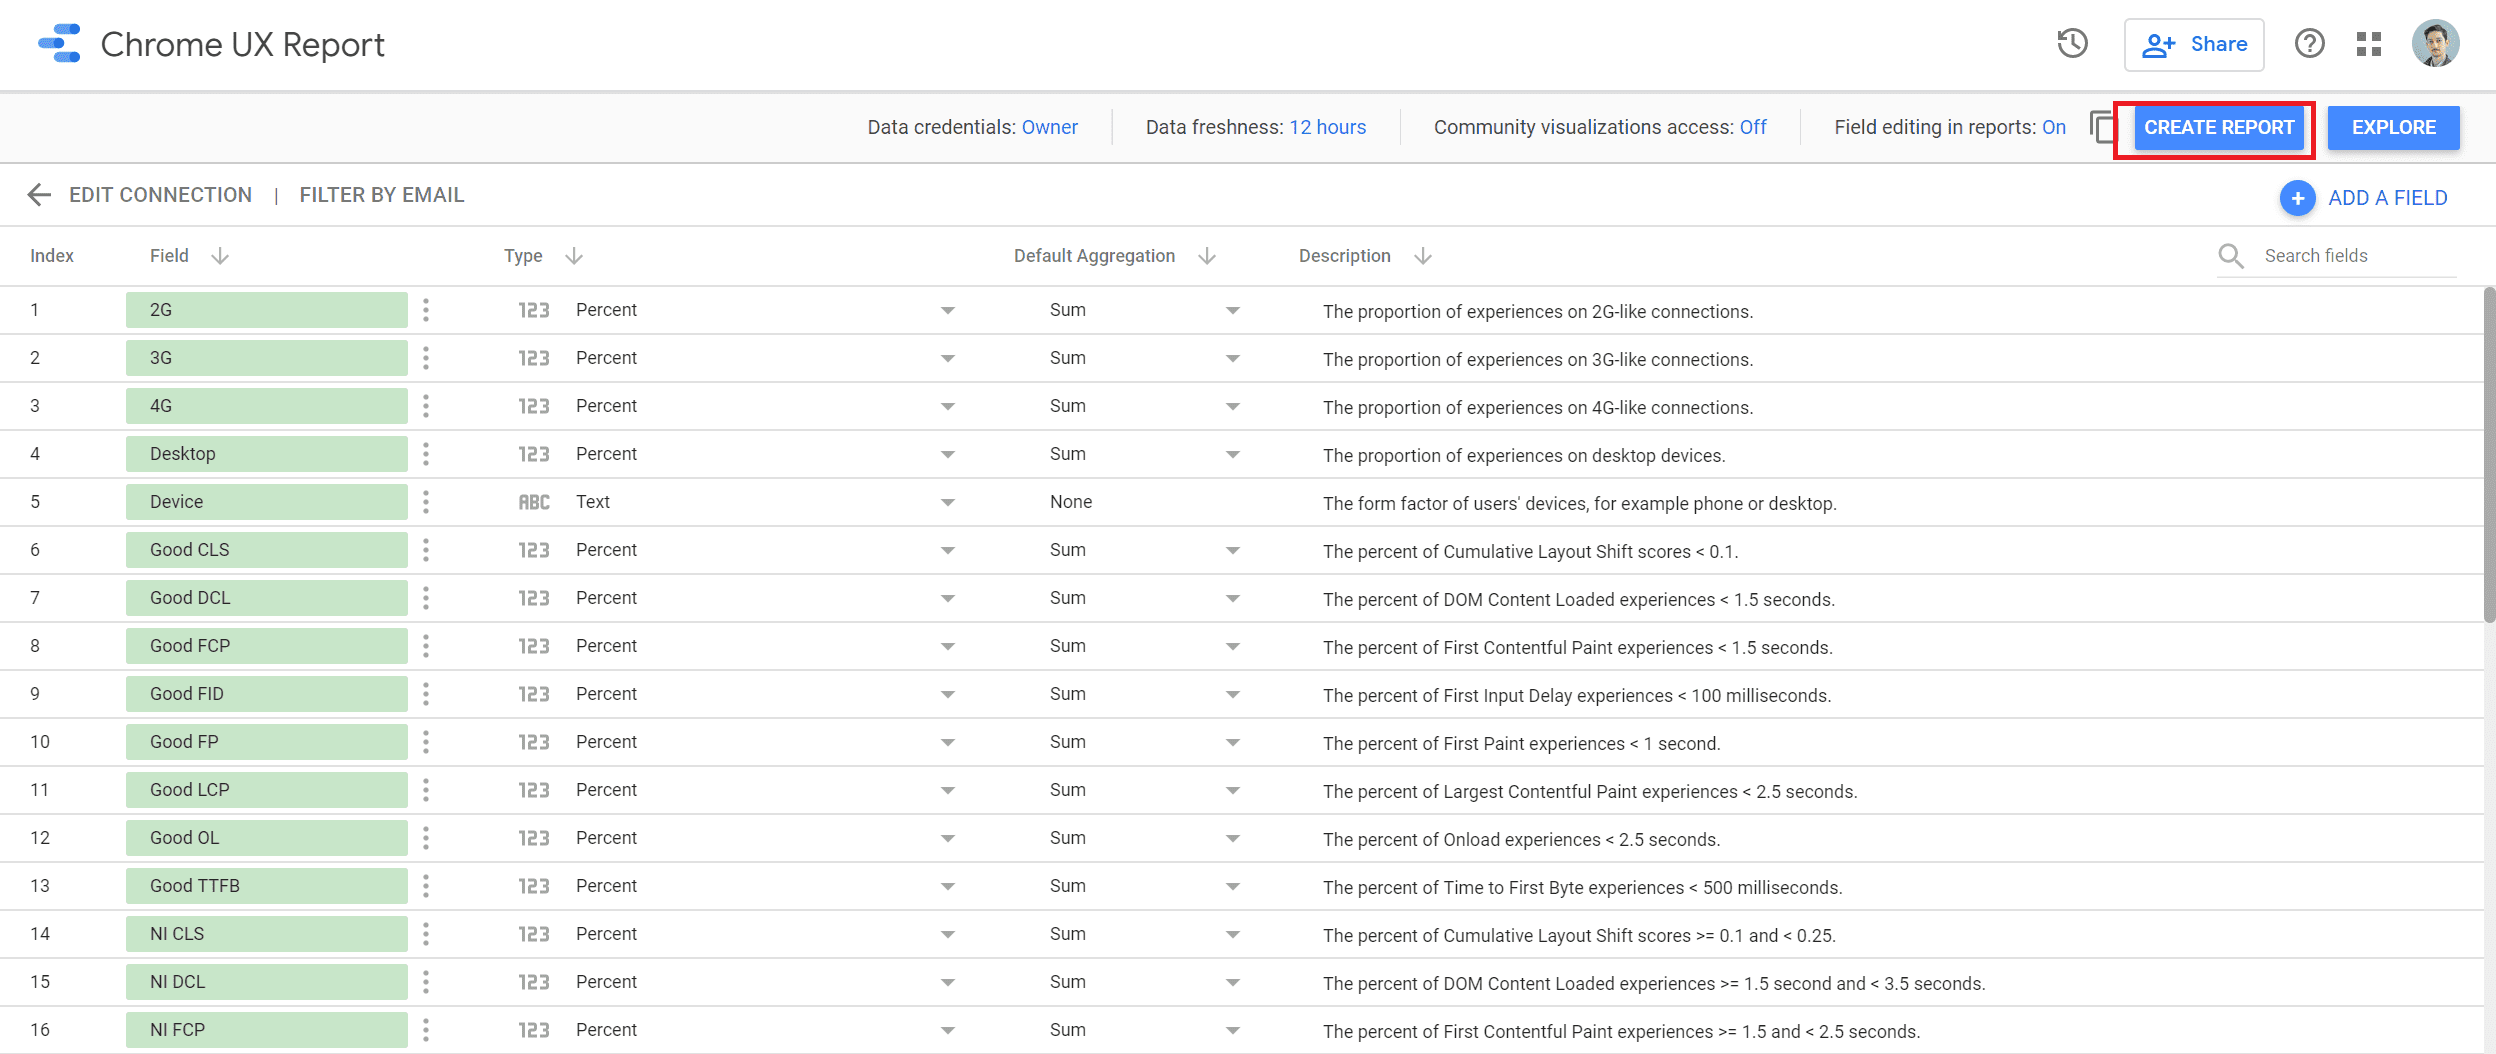
Take a look at the data schema and then press “Create Report”.
As always, the data schema in Data Studio is going to provide you additional information about each metric and dimension available in the connector. Now, the good part here, is that Google has added comprehensive descriptions against each field; this makes interpenetration much easier.
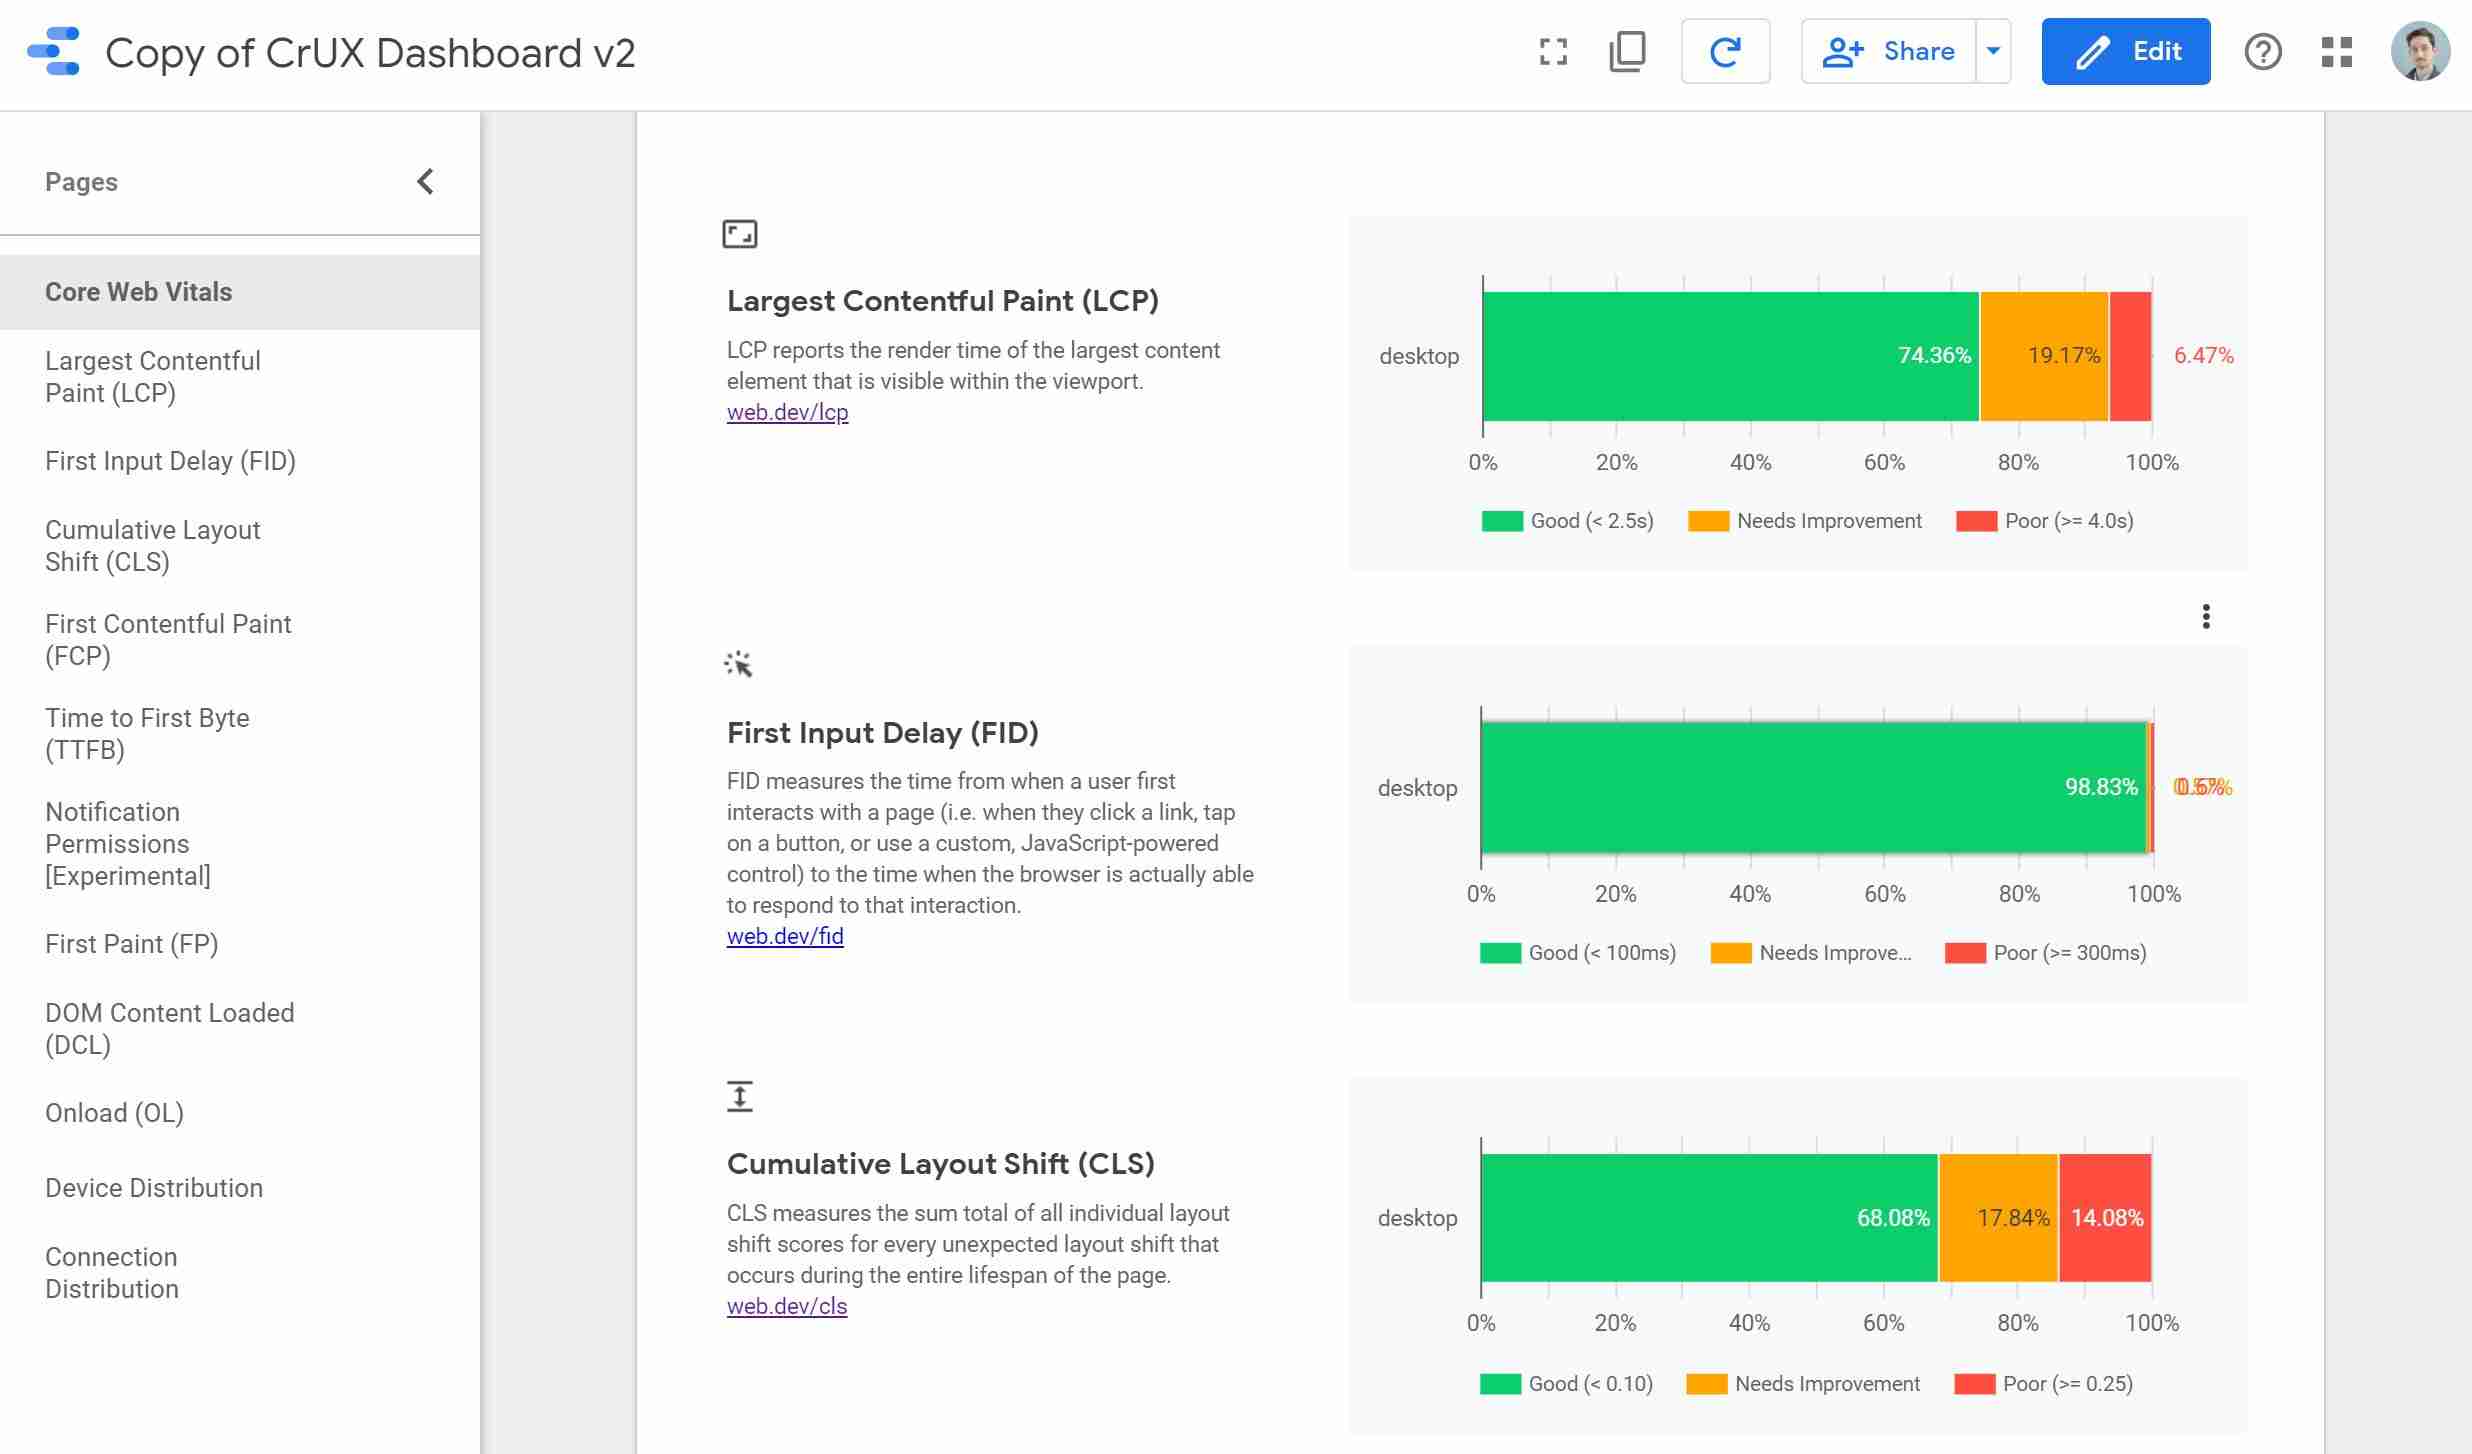
Switch to “View” mode to explore the different pages in the dashboard template.
The “Core Web Vitals” page offers a summary of the key metrics in a bullet chart form. You can edit any of the charts and see how they are setup, which really useful. Also, you can filter by Month and Device.
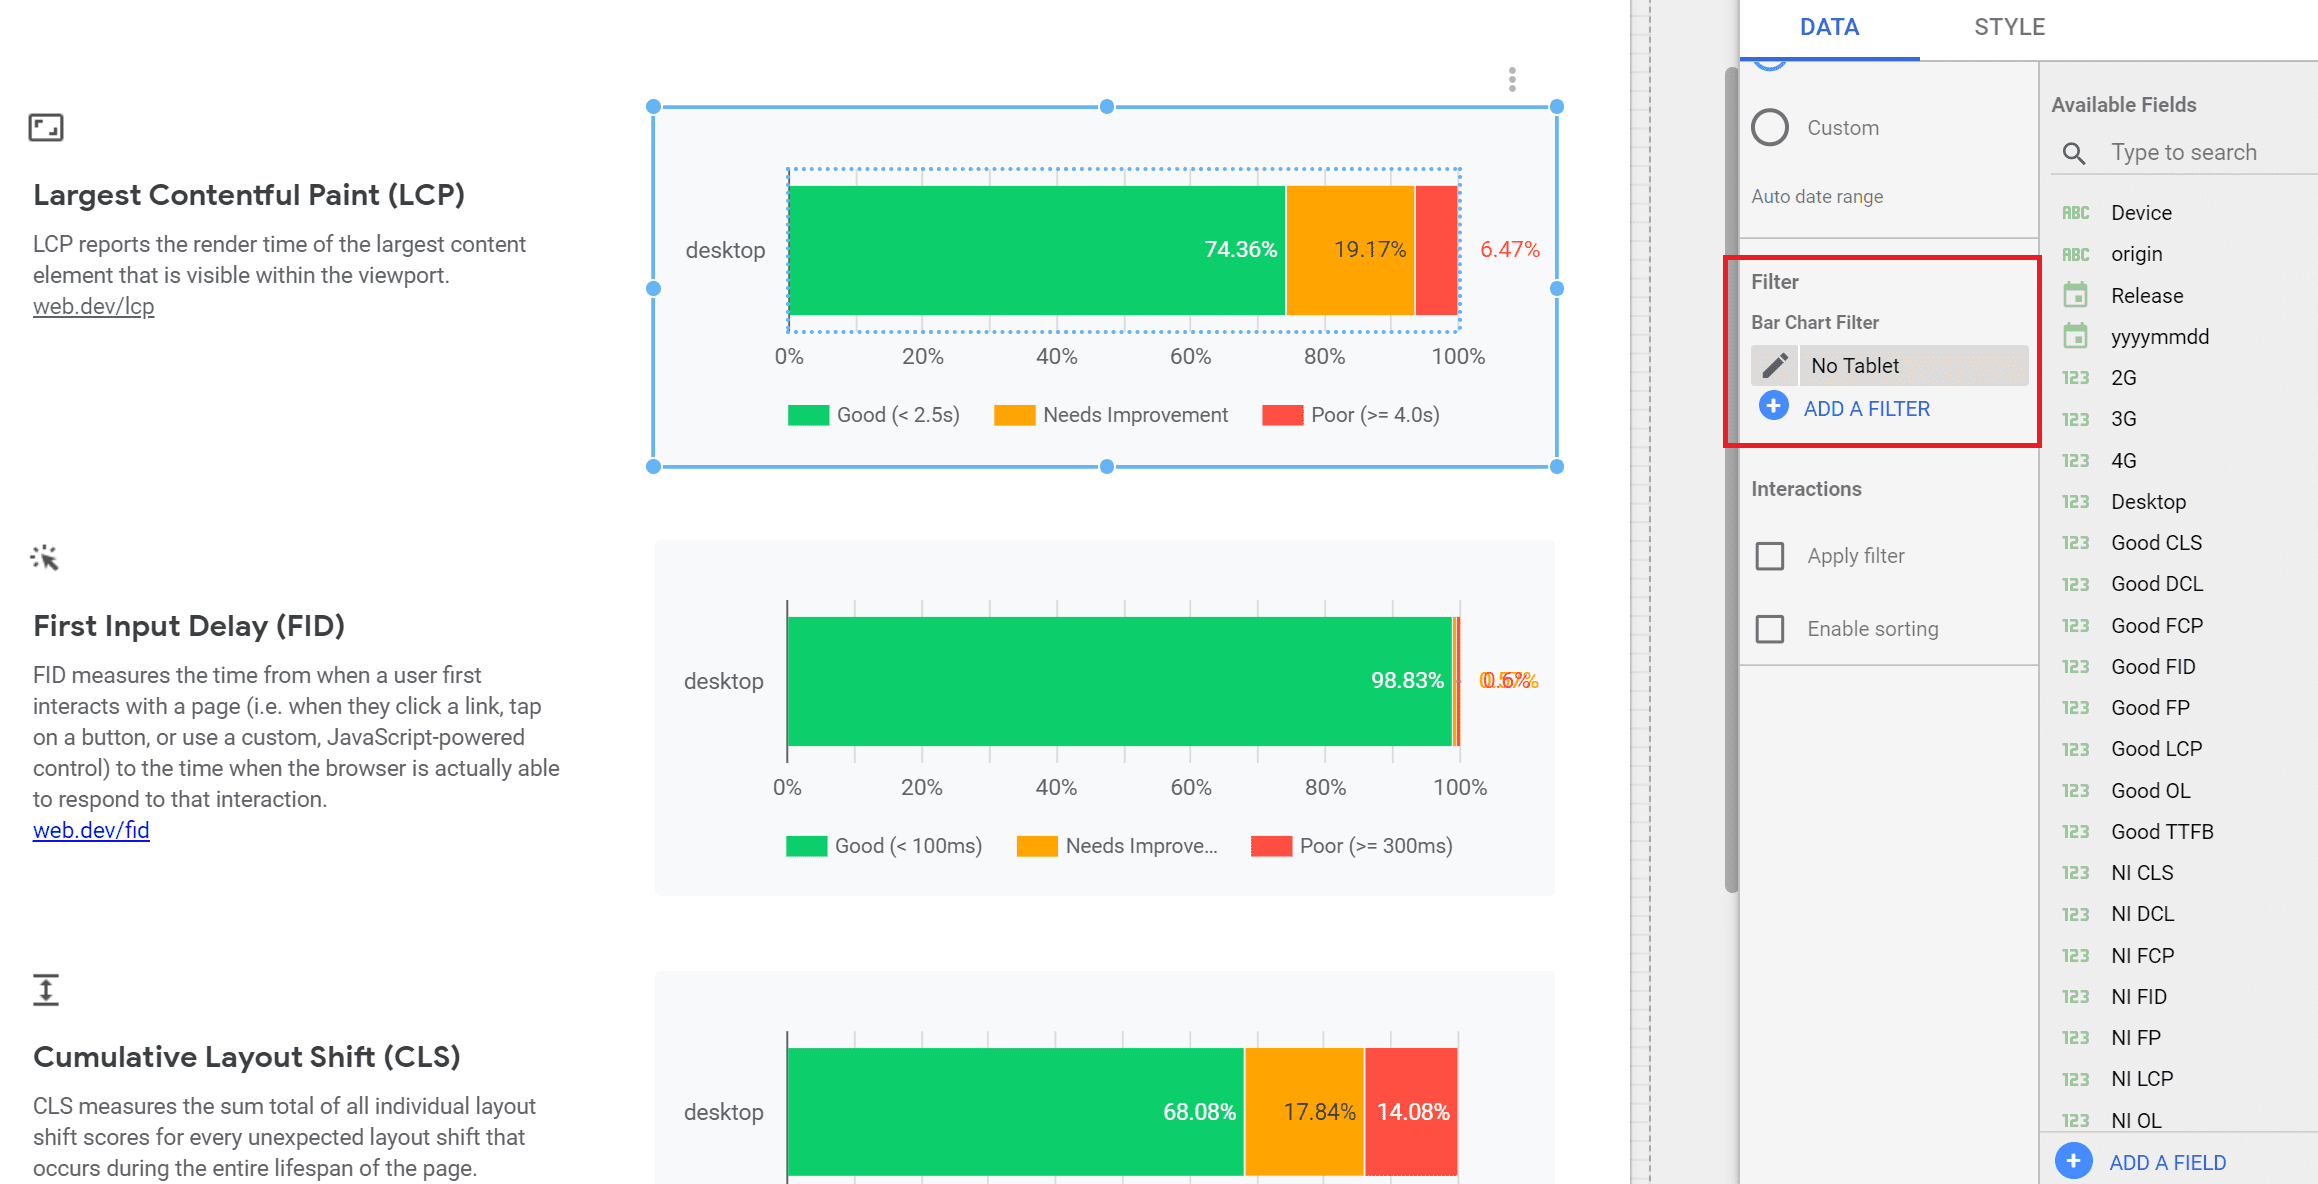
Optional: Edit your charts to add “Tablet” as a device type.
The charts in the dashboard come with a default “No Tablet” filter and if that is an important traffic source for you, feel free to remove it.
Tools
- The CrUX dashboard works via the Google Data Studio 3rd party connectors and it is a open source tool. Another important aspect to consider, the monthly datasets are released on the second Tuesday of every month.
Materials
- The CrUX dashboard template is indeed a flexible and convenient option to explore your technical SEO setup. However, if you are a SQL-driven person, you can also access the BigQuery dataset and write your own queries for different domains.
What should I look at in the CrUX dashboard?
The CrUX dashboard includes a lot of details, but there are three aspects of the user experience that Google is focusing on in 2020:
- Largest Contentful Paint (LCP): this one measures how long it takes for your page to load the largest image or text block visible within the viewport. According to Google, the LCP should be under 2.5 seconds to be considered “good”.
- First Input Delay (FID): this one measures the time it takes for your website to be interactive when a users have triggered an action (eg. button click). Here a “good” is considered less than 100 milliseconds.
- Cumulative Layout Shift (CLS): this one measures how stable your website layout design is. For a “good” experience, pages should have a CLS of less than 0.1.
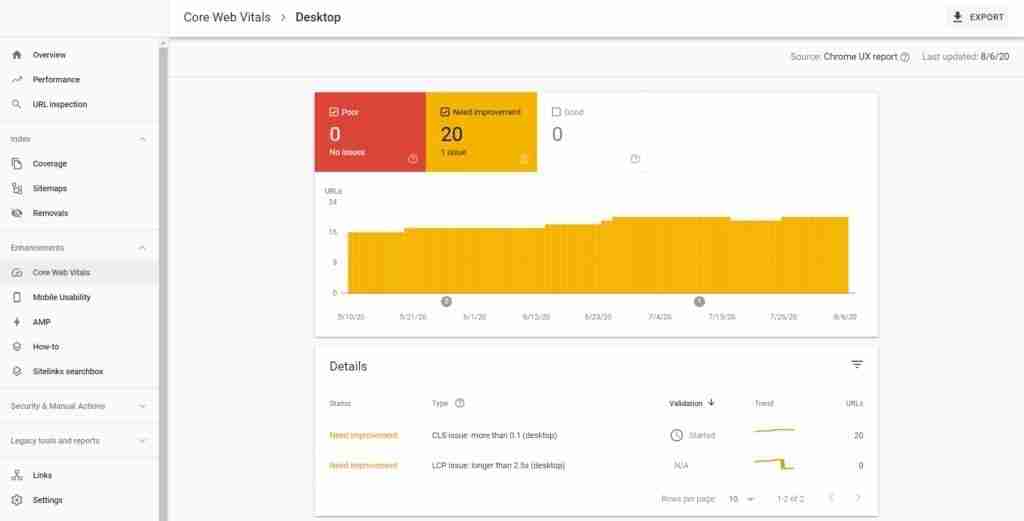
Here is a quick example of a Google Search Console that I have been managing. I have been flagged for two out of the three metrics mentioned. Essentially, Google is telling me that I need to fix certain pages to improve the UX. To take it a step further, the CrUX dashboard can enhance this view by providing rolled up metric performance distribution and device breakdown.
I hope these were helpful tips for the SEO folks out there! If you have any questions, feel free to DM me on LinkedIn or subscribe to my newsletter ?
5 comments
Thanks for sharing these details, very useful.
Glad to hear you found the content useful Rodica 🙂
Hi Lachezar,
Your article seems very helpful, however i contstantly get an erro when i try to fill an the origin url.
What i am i doing wrong, any idea?
Hey Steve, glad you are finding the article helpful. Try to input the URL without “www” in front of it. Also, normally Google adds https automatically, so if you don’t have an SSL certificate, then you would have to include http in front of your domain. Let me know if that works ^LA
I have followed all the steps to get my crux report, but I only see phone as the device and do not see desktop. How do I get both filters for phone and desktop to appear in all charts and the filter at the top?
Comments are closed.