For those of us who work in the programmatic space, knowing what digital properties our ads appear on is critical. Normally, the way you would go about reporting and checking inventory in DV360 is by pulling a report in-console. However, given the manual nature of the process, this was mostly done after the fact, when a campaign was over. Luckily, you no longer need to do that because Google Data Studio has added the dimensions “Exchange” and “App/URL” to the DV360 native connector. Yay!
Therefore, in this post, I want to show you how to use the newly released “Exchange” and “App/URL” dimensions in Data Studio to automate your inventory reporting and make finding insights much easier.
Bonus: If you read until the end, I have shared a free dashboard template too.
How to add “Exchange” and “App/URL” dimensions to your report and why?
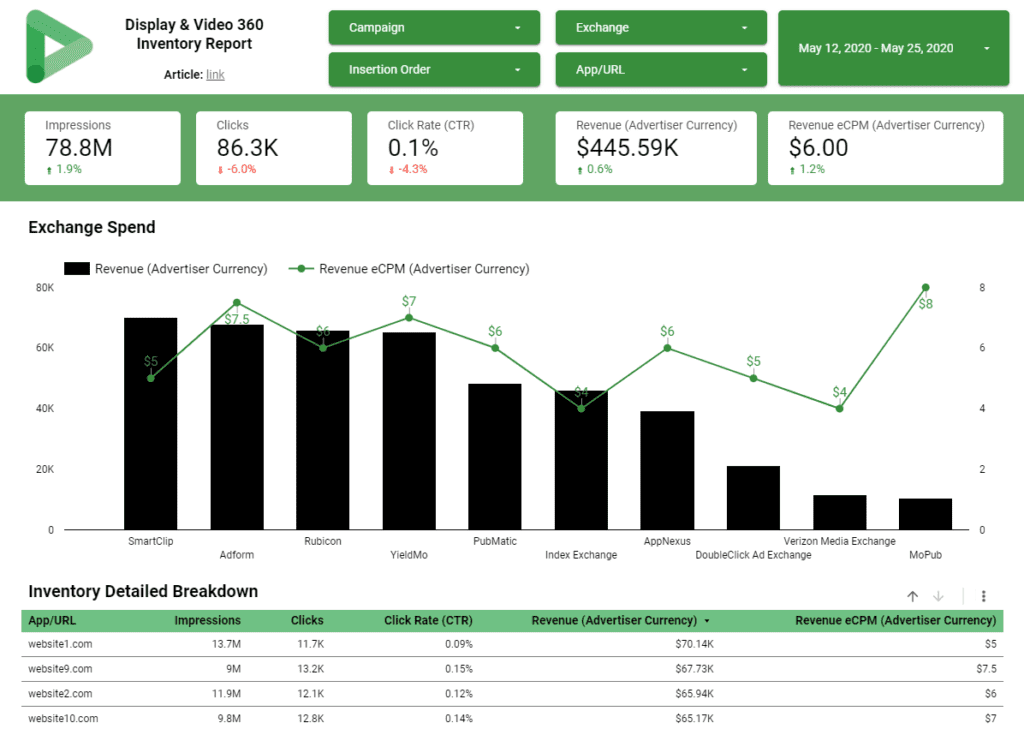
The first thing you want to do is, connect DV360 to a Data Studio report. This can be done by clicking “Add data” in any new Data Studio report. Then pick the “Exchange” and “App/URL” dimensions in a table, as they are going to be your main inventory dimensions. You can add the standard “Impressions”, “Clicks”, “Revenue (Advertiser Currency)” and “Revenue eCPM (Advertiser Currency)” as metrics. A quick reminder, the metrics that contain Revenue in them are essentially your media cost. This is just how DV360 displays them.
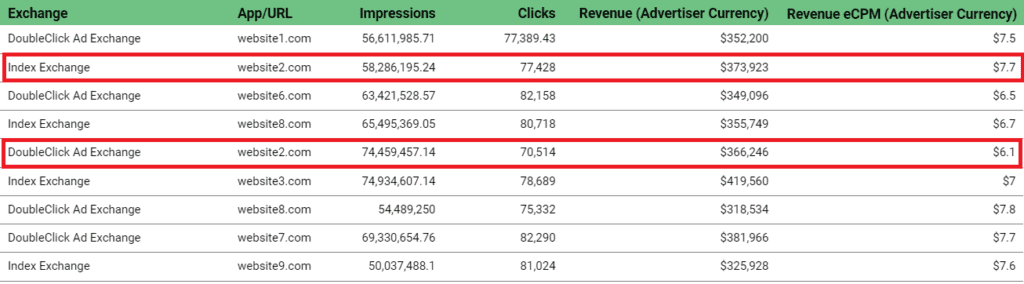
The beauty of this table is that you are not only using the direct data connector, but you can also find great insights easily. For instance, you can see that you are buying the inventory of a certain website via different exchanges. In our example, “website2.com” is bought by both “Index Exchange” and “DoubleClick Ad Exchange”, but the CPM for each of those exchanges varies. This is valuable information, especially if that one website is responsible for a large portion of your campaign spend.
How to combine subdomains and app inventory from the same publisher?
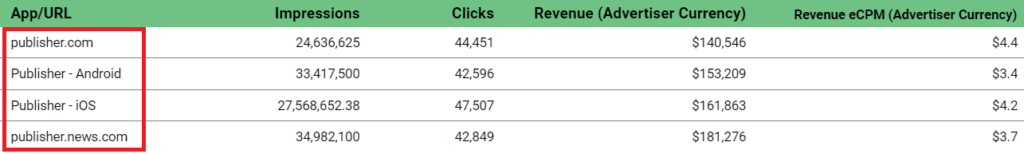
Often, DV360 splits out subdomains and apps when reporting on inventory. You might be buying from the same publisher, but your “App/URL” dimension will show separate lines. In the example below, we have “publisher.com” as the main digital property, then a subdomain for the news section of the publisher’s website – “publisher.news.com” and two separate lines for the Android and iOS apps.
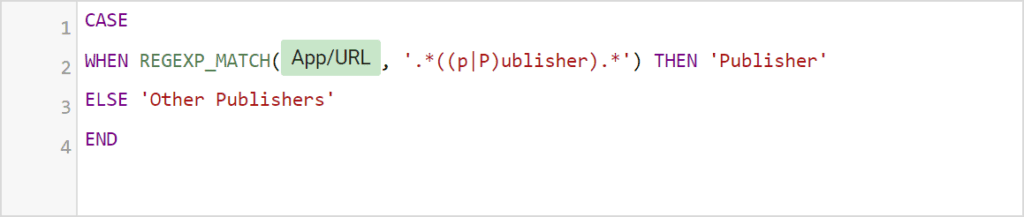
In this case, you can use CASE statements to group the subdomain and app inventory from the same publisher. This will allow you to see the real media spend and performance of the publisher. If you are not too familiar with CASE statements and Regular Expressions, I have written an introductory article on the topic. Following the example, the statement would look something like this:
How to explore the device type availability of an Exchange?
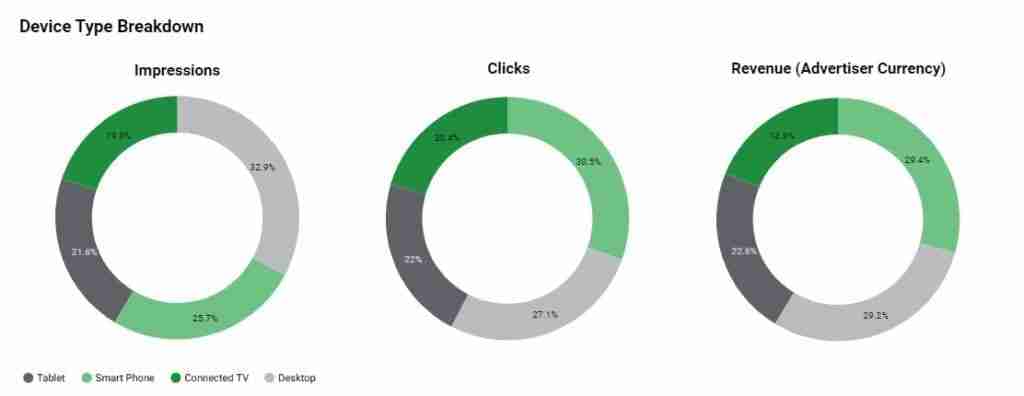
The dimension “Device Type” type is also available in the DV360 connector. For example, this allows you to see the number of impressions, bought and served per device, per exchange. This could prove to be quite powerful when you are planning a device-specific campaign.
*NEW fields available in the DV360 connector
The Google Data Studio Team is constantly working on adding additional dimensions and metrics to the DV360 connector, the most recent ones being:
- Line Item Type
- Inventory Source Type
- Creative Type
- CM Post-View Revenue
- Inventory Delivery Method
- Insertion Order Status
- Line Item Status
Display & Video 360 (DV360) Inventory Report in Data Studio
I have put together a dashboard template that combines everything I have mentioned so far. If you are trying to directly connect your Display & Video 360 instance, some of the metrics/dimensions might show as broken. I am working on a way to improve the experience, but in the meantime, you just have to replace them manually. Once that is done, the dashboard works perfectly fine!
I hope this was helpful! If you have any questions, feel free to DM me on LinkedIn or leave a comment below.