Calculated fields and functions are at the core of Google Data Studio! In this post, I want to share with you a few practical use-cases that I find quite helpful and time-saving. As you probably already know, the Data Studio functions are always evolving, so I will try to keep this post up-to-date, if any changes occur in the future.
Summary
- CASE Functions in Data Studio
- REGEXP_EXTRACT and REGEXP_REPLACE Functions in Data Studio
- CONCAT and IMAGE Functions in Data Studio
- DATE_DIFF Function
- LOWER/UPPER Function
Let’s dive into the world of functions! 🙂
1. CASE Functions in Data Studio
In a previous post, I wrote an introductory article with a lot of examples on how to use CASE statements in Google Data Studio, so if you are starting out, I would recommend you to look at that first. For this scenario, I want to focus on a more complex use of the CASE function.
Scenario 1: How do I re-create my Google Analytics “Custom Channel Groupings” in Google Data Studio?
In Google Analytics, users have the capability to create “Custom Channel Groupings” that allow them to sort how users have arrived at their website (eg. direct, organic search and etc). However, the Google Analytics native connector for Data Studio does not offer those groupings. Therefore, you have to create them yourself with a CASE, which is actually a positive, because Data Studio gives you much more flexibility with functions when compared to the “Custom Channel Groupings” in Google Analytics.
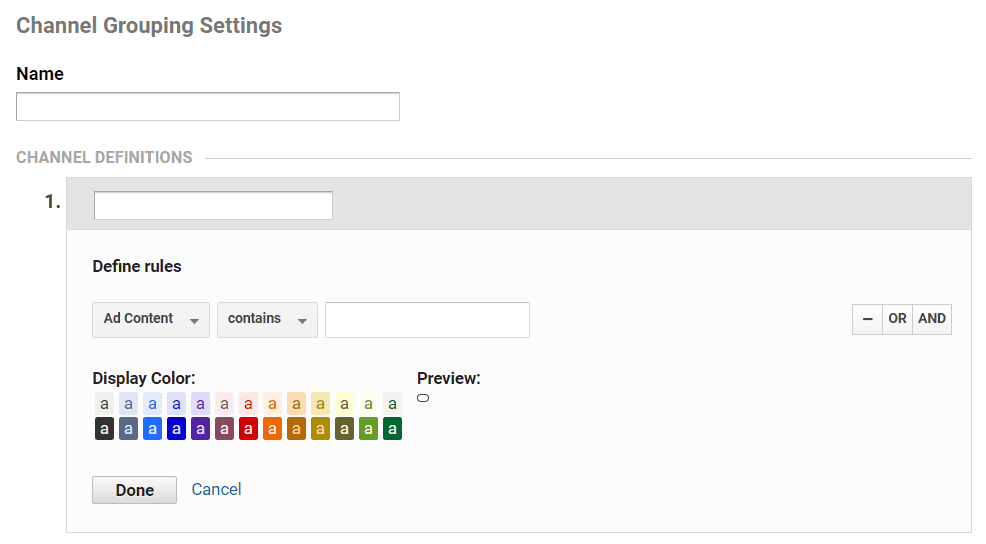
As usual, you would have to create a new calculated field at the data source-level. Since the “Custom Channel Groupings” are going to include an extensive list of “Source/Medium” attributes, your CASE might get a bit crowded. Nothing to worry about, I have already pre-written the code for you, but here are a few callouts:
- All CASE statements follow a sequential order when executing. For example, if your rule for “Paid Search” is generic, that might pick up the “Organic Search” data before the specific rule for “Organic Search” has had the chance to run.
- You can use OR and AND combinations within your CASE to make things more digestible. I highly recommend that.
- Always have a back-up rule! For example, you might have “Social Source Referral=Yes”, but if Google Analytics misclassifies your social channel – “l.facebook”- as “Referral”, you need to have that addressed with a regular expression.
CASE
WHEN (Source="(direct)" AND Medium="(none)") OR (Source="(direct)" AND Medium="(not set)") THEN "Direct"
WHEN (Source="google" AND Medium="cpc") OR REGEXP_MATCH(Medium,"(cpc|ppc)") THEN "Paid Search"
WHEN Medium="organic" OR REGEXP_MATCH(Source, ".*(^google|baidu|bing).*|.*(search).*") THEN "Organic Search"
WHEN Social Source Referral="Yes" OR REGEXP_MATCH(Source,".*(social|fb|facebook|twitter|linkedin|pinterest).*") THEN "Social"
WHEN REGEXP_MATCH(Source, ".*(mail|outlook).*") THEN "E-mail"
WHEN REGEXP_MATCH(Source, ".*(youtube).*") THEN "Video YouTube"
WHEN Medium="affiliate" THEN "Affiliates"
WHEN (Source="dfa" AND Medium="cpm") OR REGEXP_MATCH(Source,"(display|banner|native|.*(doubleclick).*)") THEN "Display (Campaign Manager)"
WHEN Medium="referral" THEN "Referral"
ELSE "(Other)"
END
2. REGEXP_EXTRACT and REGEXP_REPLACE Functions in Data Studio
Scenario 1: How to extract a UTM parameter into a separate dimension with REGEXP_EXTRACT?
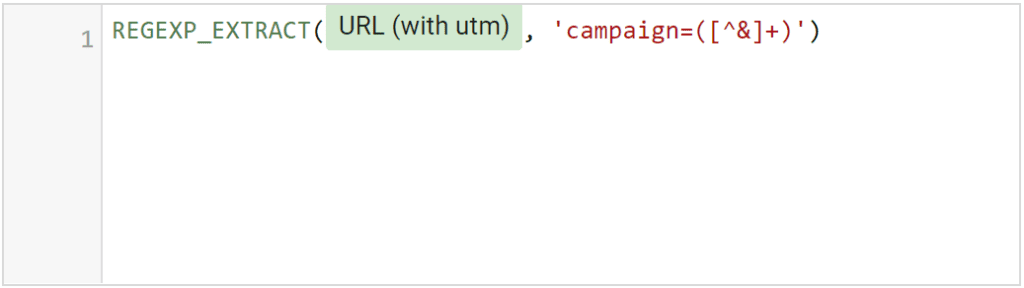
If you have multiple campaigns and want to see how each one is contributing to your business, the REGEXP_EXTRACT function can be a real time-saver. Here is an example, the URL below includes a campaign name that we want to extract, as that part of the UTM is valuable to us.
https://datastudio.ca/?utm_source=dfa&utm_medium=cpm&utm_campaign=summer_sale
In this case, you would have to write the formula below. Firstly, selecting the dimensions that you want to extract from – “URL (with utm)”. After that, the regular expression simply says “starting from campaign= match everything until you reach another &“.
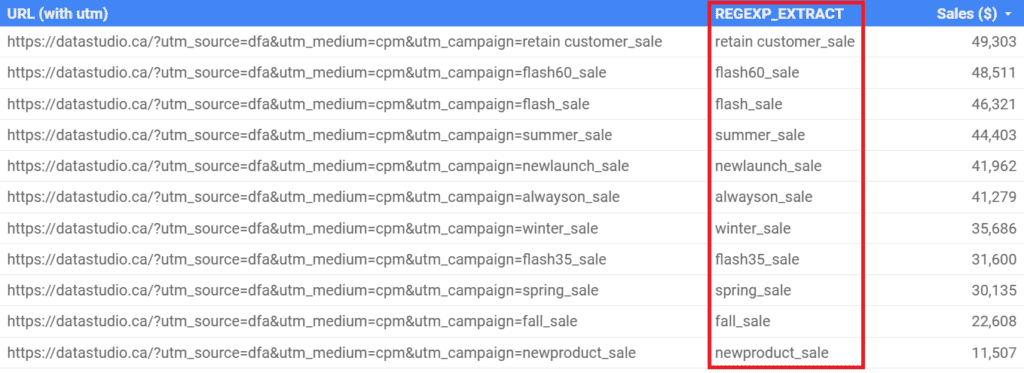
Once you apply the function, the result is pretty cool. We have extracted the campaign name in a separate and much cleaner dimension.
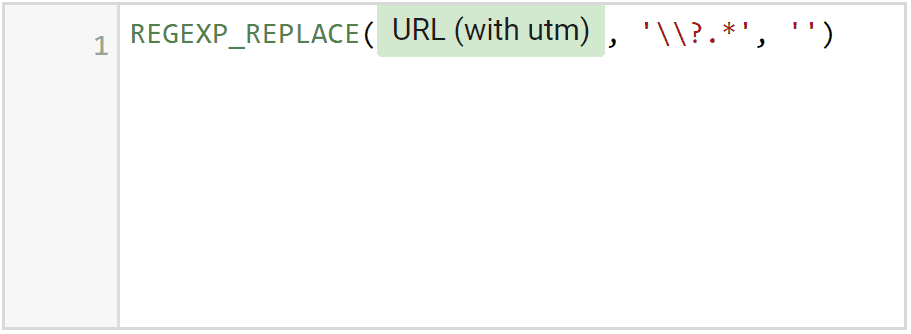
Scenario 2: How to remove parameters from URLs with REGEXP_REPLACE?
Building upon the previous function, let’s assume that you want to remove all parameters to get the original URL. This is often used when you want to only see the traffic to a landing page and ignore all parameters. In our case, you can write the formula below. Once again, the regular expression says “look for anything after ?“. Then, the third argument specifies what we want our replacement to be. We simply leave that blank.
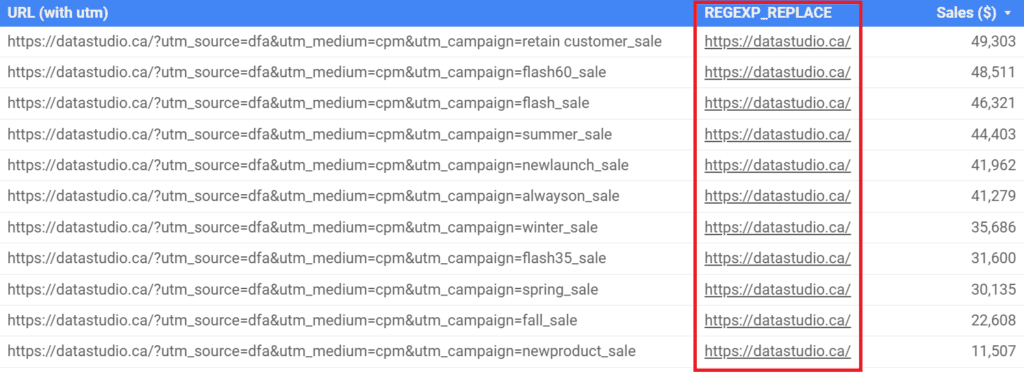
The final table would look something like this and our URL is now much more visible.
3. CONCAT and IMAGE Functions in Data Studio
Scenario 1: How do I use CONCAT to combine dimensions?
This is a function that could prove to be extremely useful, especially if you are working with Campaign Manager (CM) or Google Ads. For many organizations, “naming conventions” are important, as they allow for easy data parsing. Well, with the CONCAT function, you can combine a few pre-existing fields into a single and more powerful dimension. Here is how it works:
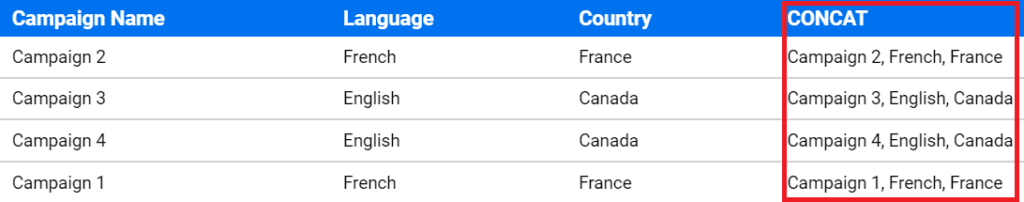
Luckily, the function has a simple syntax. You type your first dimension, in this case, “Campaign Name” and then a delimiter. The delimiter specifies how dimensions will be separated from each other. A few common delimiters are “|”(pipe) and “,”(comma).

The result is a compact and more informative dimension that combines all of the three fields. Remember, you can add as many dimensions as you want, as long as the final field is useful to you.
Scenario 2: How do I use CONCAT with IMAGE to display images in a table?
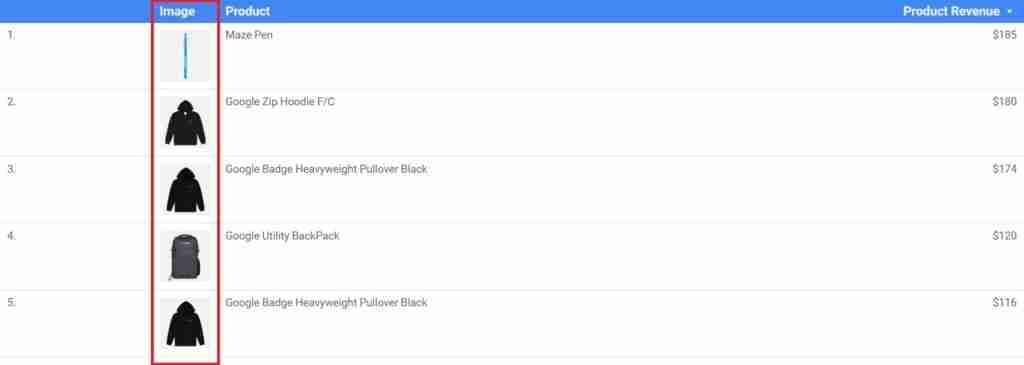
A more advanced and exciting use of the CONCAT function is nesting it inside an IMAGE function. For this scenario, I have used the product data from the Google Analytics Demo Account. All we are doing here is, using “Product SKU” as a dynamic dimension since the product code is used in the URL. You can apply this same methodology with your eCommerece data set, as long as you have a dynamic element in the URL.

Once you have created the IMAGE calculated field, you can add it to a table. You will see the images showing-up immediately. A little caveat, the IMAGE dimension is only supported in tables, not other chart types.
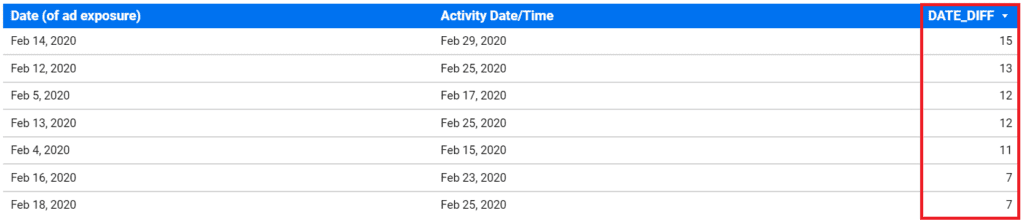
4. DATE_DIFF Function
Scenario 1: How do I calculate the difference between two dates using DATE_DIFF?
This is a familiar one for those of you who use SQL on a regular basis. The function returns the difference between two date/time values in a numeric format. An interesting scenario where I found this function useful is paid media for eCommerce. We often look at the time a user was exposed to an ad and the time he/she actually made a purchase. This gives us a sense of what we would call “time-lag”, which indicates that the user needs some time to think before committing to a purchase. This is exactly where DATE_DIFF kicks-in.
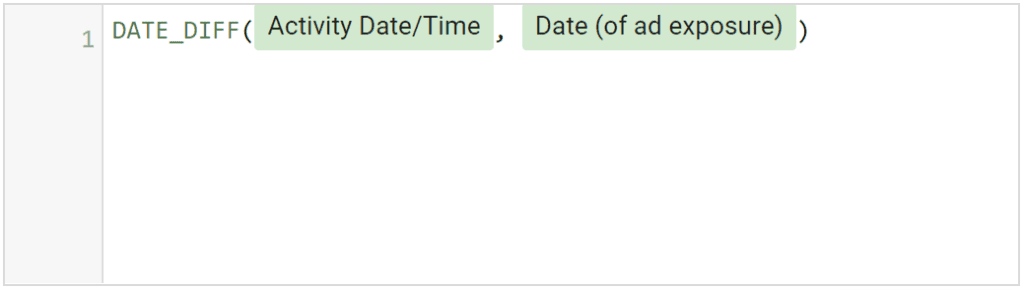
The formula is straight-forward, you just have to include the two date fields that need to be subtracted.
5. LOWER/UPPER Function
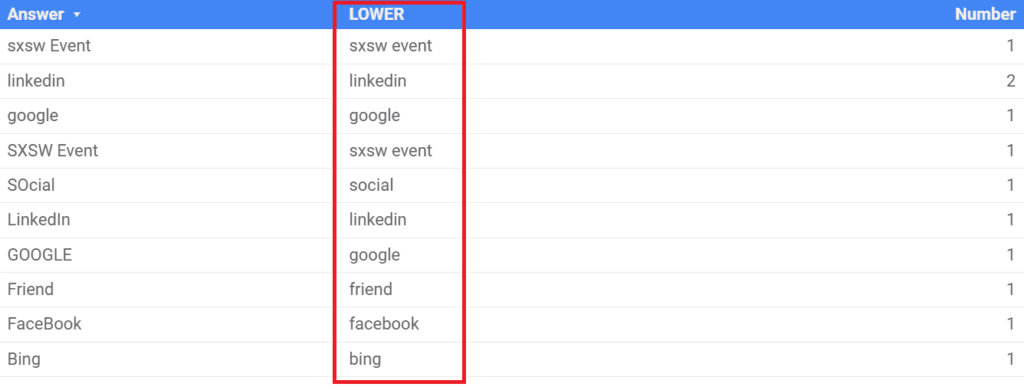
Scenario 1: How to use LOWER and UPPER functions to standardize text strings?
Last but not least, this function allows you to standardize your text dimensions. For example, imagine you have an online form on your website with a free-form input field that asks “How did you hear about us?” and the input field is free-form. The user might input any type of capitalization, so to clean up the mess, we can use LOWER.
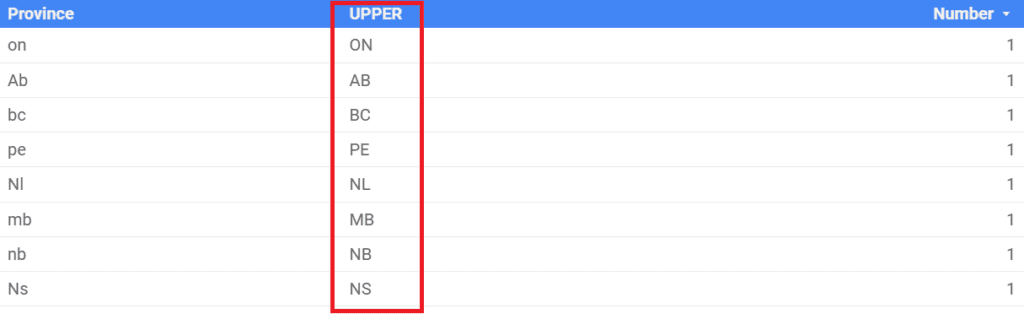
You can also use the UPPER function in a similar fashion, converting all provinces to the standard uppercase abbreviations.
I hope this was helpful and you can now use all of these Data Studio functions in your own projects! If you have any questions, feel free to DM me on LinkedIn ?
Dynamic Dashboards and Data Analysis with Google Data Studio – 2021
If you want to learn how to build powerful data visualizations and unlock insights that can help you drive business results for your clients or employers, take a look at my full course on Udemy.

14 comments
This was incredibly helpful and easy to follow. I was struggling to strip some unwanted URL parameters from my data, and your REGEX_REPLACE function did the trick. Thank you!
Great to hear and glad I can be of help Amanda! 🙂
I’m trying to get the UTM tags to see different campaign values and the URL with utm is a custom dimension? cause I don’t have it in my data studio
Hey Mia, thanks for sharing this scenario. From what I can understand, the URL with the UTM is stored in a Google Analytics custom dimension. Let me know if that is correct. If that is the case, then you should be able to find that custom dimension in Google Data Studio; the custom dimension might show with an exact, as opposed being called “CustomDimension1”, which can be confusing. From there, you can create a REGEXP that parses the data in the custom dimension 🙂
Hi this is all very helpful but how does one incorporates today’s date TODAY() in Data Studio?
Hey Elie, glad you are enjoying the article! Are you trying to create a calculated field with today’s date or want to have that in the original date filter? – Lacho
Hi Lachezar,
The content of the course is too good! I have tried to create report with my main data source as bigquery views and the second data source as google sheet, how can I filter my main data source with columns which are there in google sheeet?
Thanks
Hey Deepesh, great question! You would have to create a Data Blend and include BigQuery as the LEFT source and Google Sheets as the RIGHT one. In Google Data Studio, the blending works only with a LEFT JOIN. Let me know if this helps 🙂
Hello, excellent content.
i am struggling to understand where do i find the date at which a user was exposed to an ad.
how did you manage it?
thanks
Hey Giacomo, is that in Google Analytics or at an Ad Sever level (eg. Campaign Manager)? If you are using GA, you can perhaps try the dimensions “Date Hours and Minute” and “Count of Sessions”, while having the metric “Sessions” to see when was the first website landing. If you are using CM, then you can probably try “Days since first interaction” depending on what exactly you are trying to extract? ^LA
Is there a way of calculating duration between Start time and finish time coloumns? These colums don’t contain the DATE therefor a the DATETIME_DIFF wouldn’t recognise these.
Thank you
Hey Zoltan, thanks for reaching out. You would have to use CAST to covert the current format of your field. Here is some additional information on how that works by Google.
Can I create a calculated field for visits to a specific page?
Hey there, the n.2 for having the final url without the tracking is amazing.
However, it’s incompatible with conversion data- if original final url dimension is removed from the report. So that makes it a bit useless.
Would it be possible to have a workaround for that? So, i.e. in your example, you’d see only 1 raw for the landing page (datastudio.ca) and the total sales for that page? That would be awesome.
Comments are closed.